Reading an Electric-Car Energy Display Without Misreading the Numbers

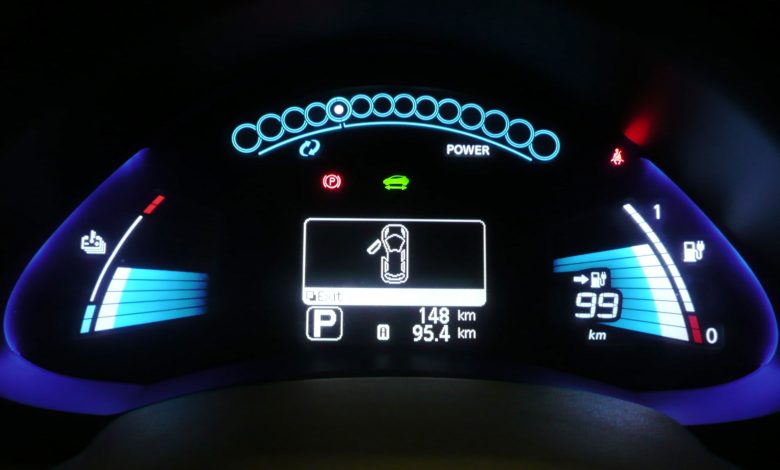
Identify the question each display answers
An electric car may show battery percentage, predicted range, current power, average consumption, and energy recovered through braking. These measurements are related, but each answers a different question. Understanding the labels is more useful than treating the largest number as the most important one. Begin with the units and the time or distance period being measured.
Battery percentage estimates the remaining state of charge. Range predicts a possible distance under assumptions that may change. Power shows how quickly energy is moving at a particular moment. Consumption relates energy use to travel. A brief increase in power does not necessarily mean the average consumption for the whole journey will be poor.
Read the units before judging the trend
Record whether the display uses energy per distance or distance per energy. Higher is favorable for one format and lower for the other; comparing numbers without units can reverse your conclusion.
Check which direction means better efficiency
Some vehicles show distance traveled per unit of energy, while others show energy used per unit of distance. With distance per energy, a larger value generally indicates better efficiency. With energy per distance, a smaller value generally indicates better efficiency. Confirm the setting before comparing notes with another owner or reading a route summary.
For example, a driver switching display units can mistakenly think the car became less efficient because the number moved in the opposite direction. The underlying journey may be unchanged. Keep units consistent when building your own records, and avoid comparing values from different reset periods as though they describe the same driving conditions.
| Reading | Question it answers | Interpretation caution |
|---|---|---|
| Instantaneous power | How quickly energy is moving now | A momentary peak is not trip consumption |
| Average energy per distance | How much a chosen journey used per distance | Reset point and trip length shape the result |
| Estimated remaining range | How far the car predicts it may travel | Conditions and future speed can change it |
Use complete trips rather than isolated moments
Short-term consumption can swing sharply during acceleration, climbing, cabin heating, or parking maneuvers. A journey average provides more context, although very short trips still emphasize startup demands. Look at a representative set of journeys before making judgments about the car’s typical efficiency. Weather and route differences deserve a place beside the number.
A steep climb may consume substantial energy early in a route. A later descent can recover some of it, but not all. Checking the display only at the summit exaggerates the final journey demand. Similarly, resetting the trip meter after the cabin has warmed can make the recorded journey look better than the complete departure-to-arrival experience.
Interpret the range estimate as a planning aid
Predicted range often responds to recent consumption and operating conditions. A fall after a highway drive can reflect a revised assumption rather than sudden battery damage. Use navigation estimates, observed battery use, and charging alternatives together. No single range number can account perfectly for every future wind change, detour, or traffic delay.
If your normal trip begins with fast roads and ends in slower traffic, the estimate may change as the journey develops. Notice whether the planned arrival reserve remains comfortable. Make route changes while there is time to act, and avoid chasing every small fluctuation by repeatedly changing settings or speed.
An energy display becomes informative when you know its units, its time window, and the question it answers.
Editorial takeaway
Turn the display into a useful record
For a few comparable trips, note distance, consumption, temperature, and any unusual load or route feature after parking. This modest record can reveal patterns without constant screen watching. Learn the manual’s definitions and reset behavior. The display becomes valuable when it helps you plan and describe changes clearly, while your attention during travel remains on the road rather than on maximizing a dashboard score.
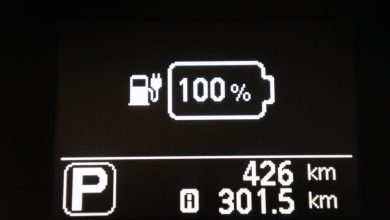
Featured image: Nissan Leaf Dashboard Display 2 by RudolfSimon, CC BY 3.0. Image reproduced without editorial alteration; WordPress may create resized display copies.